
 SoMa
SoMa
Data as of Oct 6, 2026
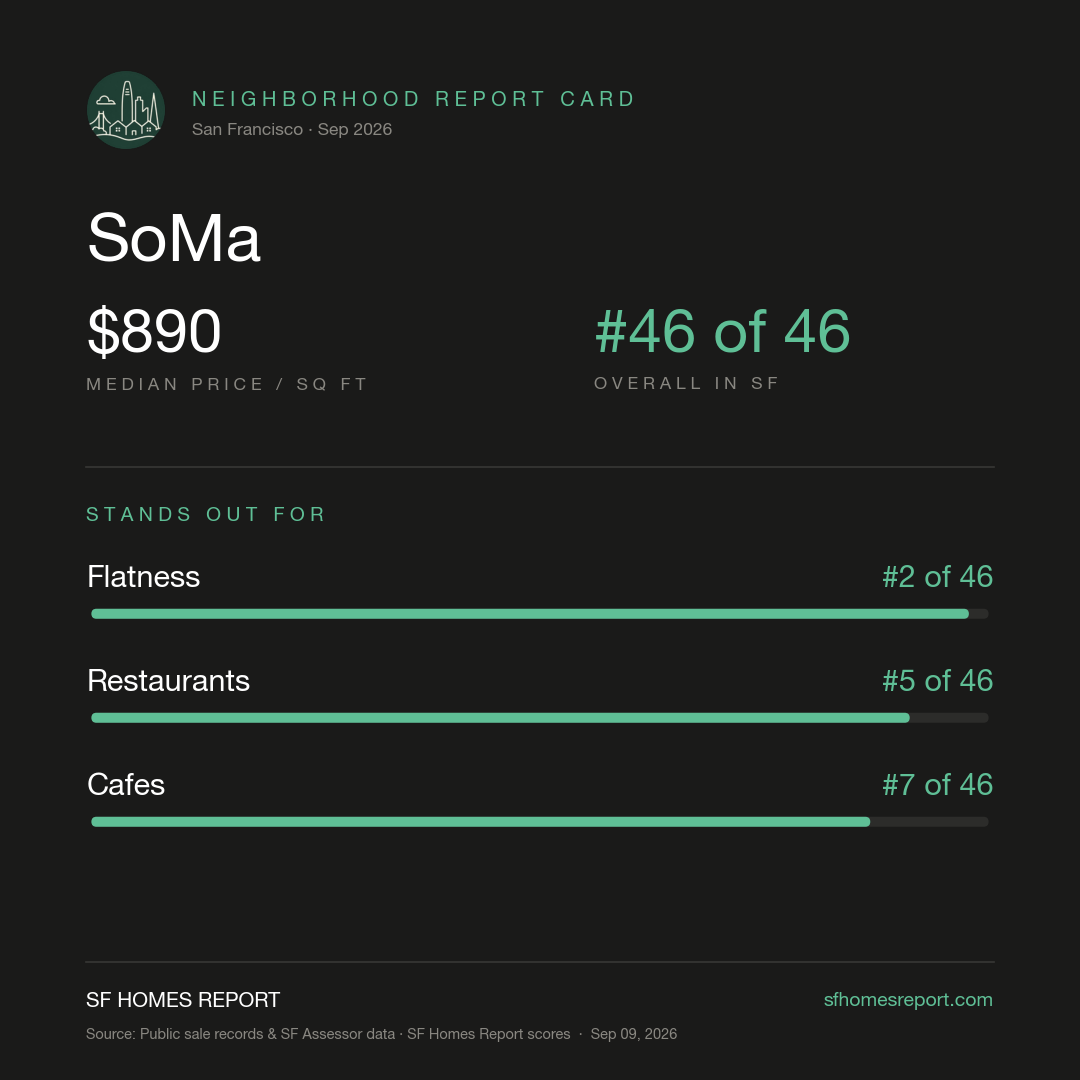
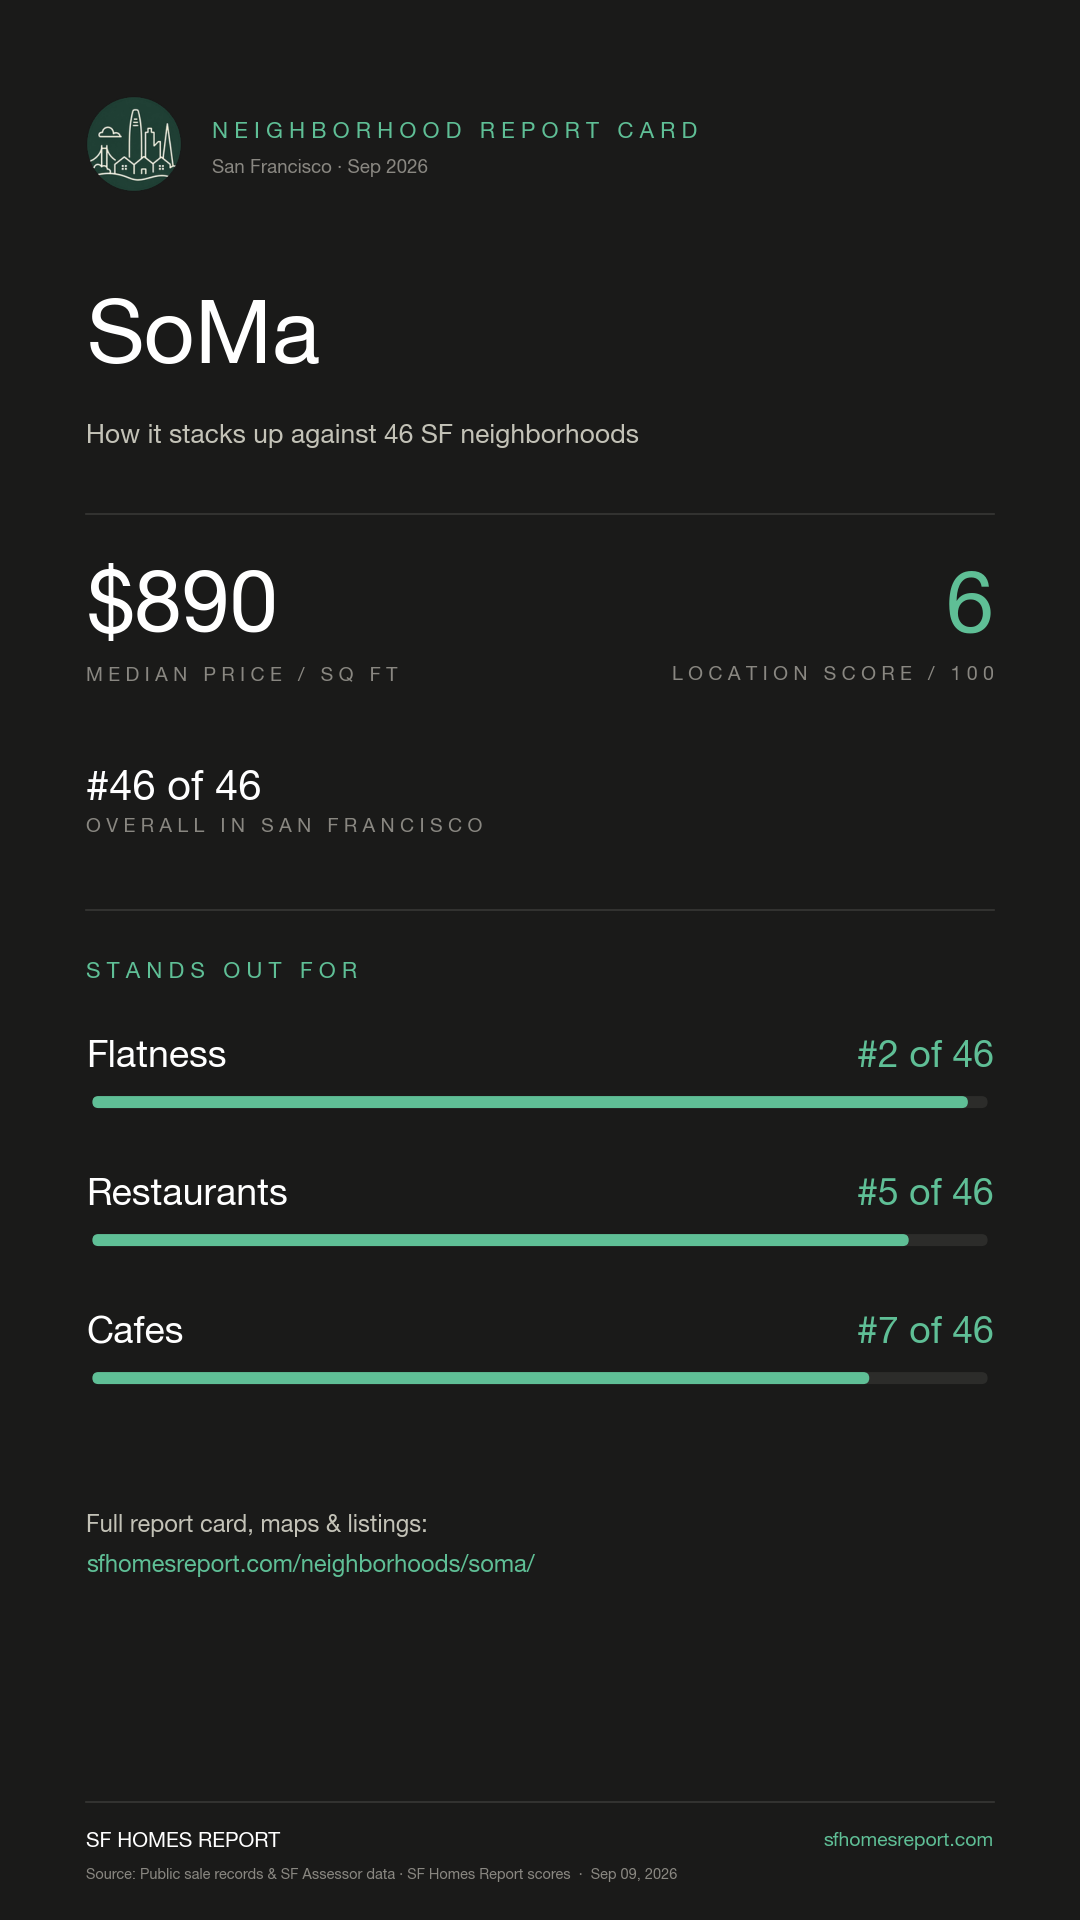
Share this neighborhood
Free stat card with SoMa's prices and rankings — made for Instagram.
Download for Instagram Stories Download square imageSoMa (South of Market) is San Francisco’s largest and most dynamic neighborhood, a sprawling district of converted warehouses, modern high-rises, tech offices, and cultural landmarks like SFMOMA and Yerba Buena Gardens. Its diverse sub-areas range from gritty industrial blocks to gleaming residential towers. SoMa’s central location and continued development make it a constantly evolving frontier for urban living.
Quick answers
Figures from public sale records and public datasets tracked by SF Homes Report. Updated 2026-10-06.
What is the median home price in SoMa?
The median sale price in SoMa was $930K for houses (66 sales, across sales since 2021 (through the second half of 2026)) and $784K for condos (118 sales, in the 12 months through October 2026), per public sale records tracked by SF Homes Report.
What is the price per square foot in SoMa?
SoMa homes sold for a median of $904 per square foot for houses and $820 per square foot for condos across sales since 2021 (through the second half of 2026) (public sale records tracked by SF Homes Report).
How much does a 2-bedroom condo cost in SoMa?
The median 2-bedroom condo in SoMa sold for $980K (interquartile range $860K–$1.10M, 45 sales) in the 12 months through October 2026, per public sale records tracked by SF Homes Report.
How walkable is SoMa?
SoMa scores 60/100 on SF Homes Report's walkability index, ranking #14 of 46 San Francisco neighborhoods. Scores are built from public datasets (DataSF, EPA, Census).
Is SoMa safe?
SoMa ranks #46 of 46 San Francisco neighborhoods for safety on SF Homes Report's index (#1 = best). Its crime density score is 88/100, where lower is better. Scores are built from public datasets (DataSF, EPA, Census).
Are home prices going up in SoMa?
Median price per square foot in SoMa in the 12 months through October 2026, compared with the 12 months before: condos up 12% ($820 vs $729, 118 and 83 sales), per public sale records tracked by SF Homes Report.
How does SoMa rank among San Francisco neighborhoods?
SoMa ranks #46 of 46 in SF Homes Report's overall neighborhood ranking, which blends walkability, safety, transit, schools, amenities and appreciation from public data.
How many homes sold in SoMa in the last year?
125 homes sold in SoMa in the past 12 months (through October 2026), per public sale records tracked by SF Homes Report.
2 Bedroom Homes
Based on SF Assessor data from the past 5 years
3 Bedroom Homes
Based on SF Assessor data from the past 5 years
Neighborhood Map
Available Listings in SoMa

Browse by Property Type
Browse by Price Range
SoMa Neighborhood Scores
- Are Schools Good in SoMa?
- Are There Good Cafes in SoMa?
- Are There Good Restaurants in SoMa?
- Are There Many Trees in SoMa?
- Does SoMa Have Historic Architecture?
- How Are Sidewalks in SoMa?
- How Has SoMa Appreciated in 5 Years?
- Is Commuting Easy from SoMa?
- Is Parking Easy in SoMa?
- Is SoMa a Good Investment?
- Is SoMa Bikeable?
- Is SoMa Clean?
- Is SoMa Flat?
- Is SoMa Kid-Friendly?
- Is SoMa Pet-Friendly?
- Is SoMa Quiet?
- Is SoMa Safe at Night?
- Is SoMa Safe for Pedestrians?
- Is SoMa Safe?
- Is SoMa Sunny?
- Is SoMa Walkable?
- What Is the Homeownership Rate in SoMa?
- What Is the Median Income in SoMa?