Mission District

Data as of Oct 6, 2026

Mission District neighborhood report card

Share this neighborhood

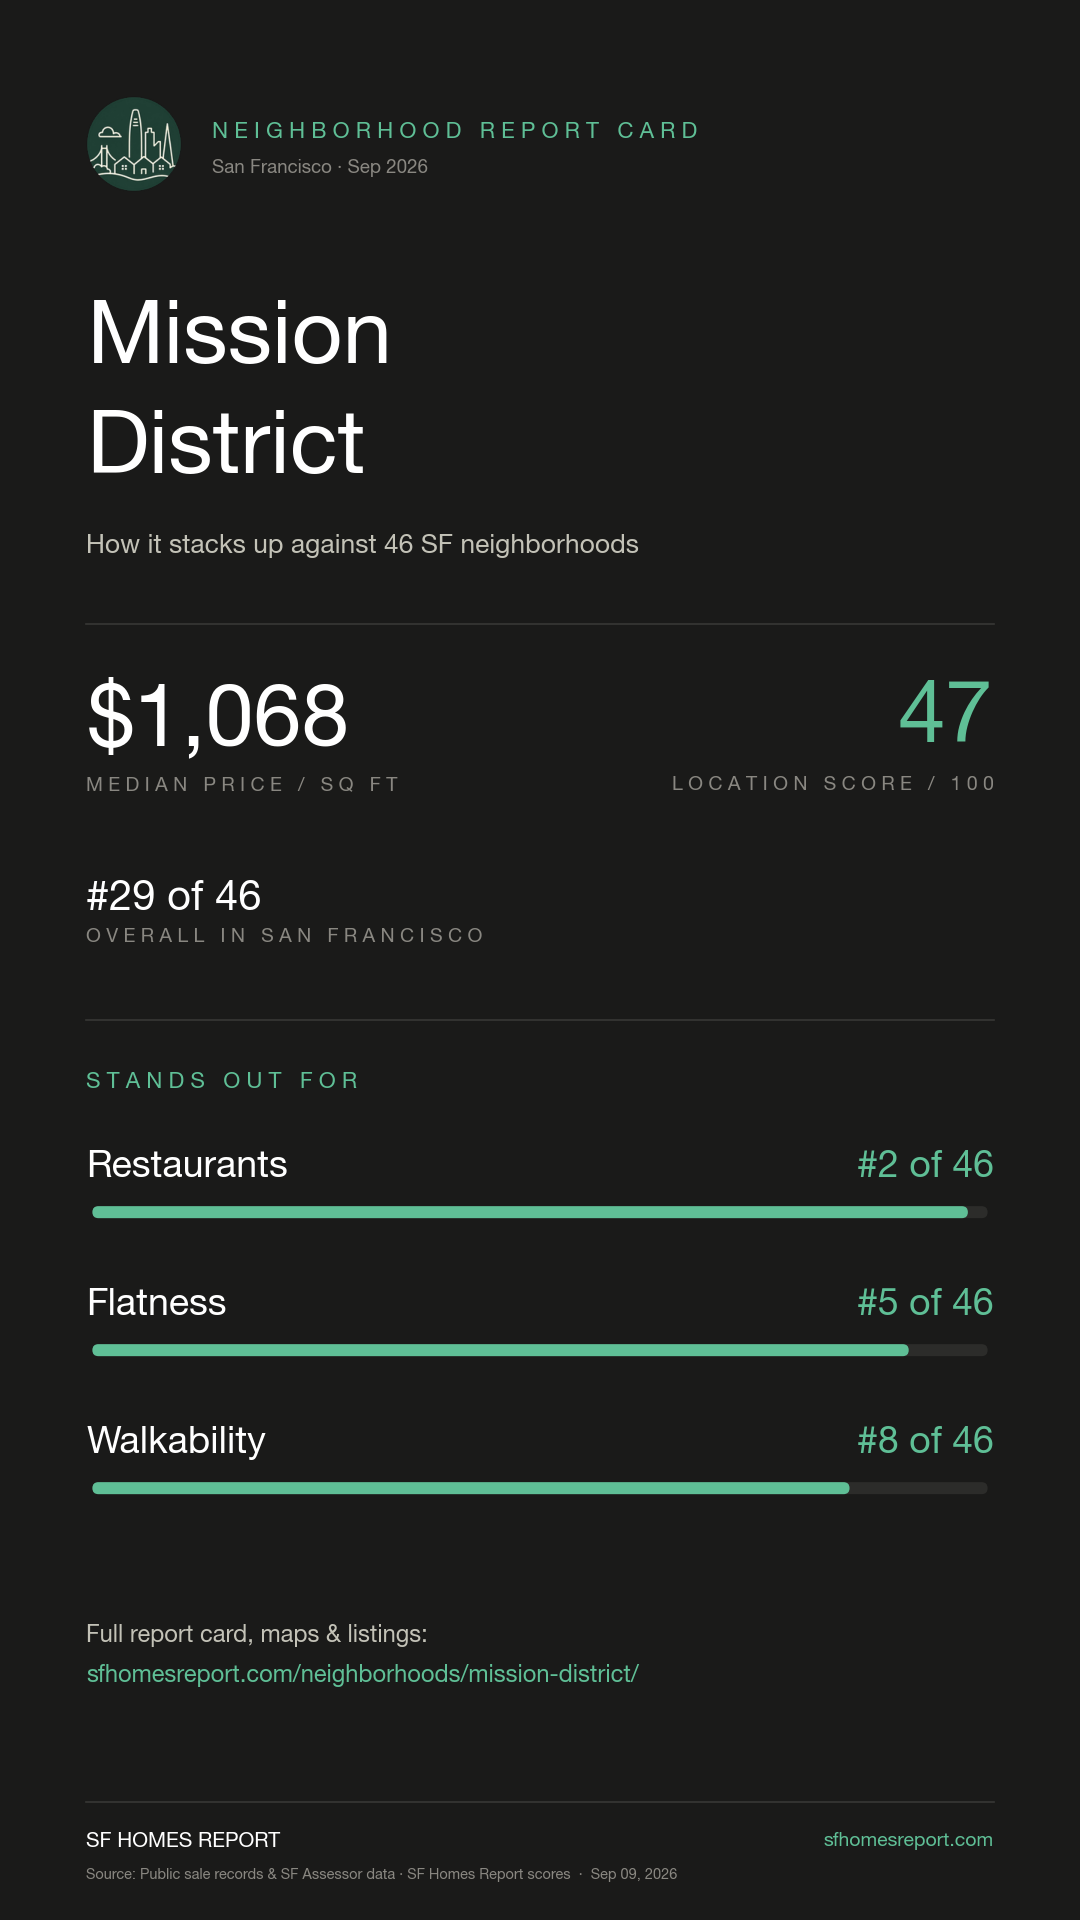
Free stat card with Mission District's prices and rankings — made for Instagram.

Download for Instagram Stories Download square image

The Mission District is San Francisco’s vibrant cultural heart, known for its colorful murals, thriving Latino heritage, and one of the city’s best food and nightlife scenes along Valencia and Mission streets. The neighborhood enjoys the city’s sunniest weather and features a mix of Victorian flats, modern condos, and live-work lofts. Its creative energy and diverse community make it one of the most dynamic neighborhoods in the city.

Quick answers

Figures from public sale records and public datasets tracked by SF Homes Report. Updated 2026-10-06.

What is the median home price in Mission District?

The median sale price in Mission District was $1.67M for houses (85 sales, in the 12 months through October 2026) and $1.10M for condos (159 sales, in the 12 months through October 2026), per public sale records tracked by SF Homes Report.

What is the price per square foot in Mission District?

Mission District homes sold for a median of $1,053 per square foot for houses and $996 per square foot for condos in the 12 months through October 2026 (public sale records tracked by SF Homes Report).

How much does a 2-bedroom condo cost in Mission District?

The median 2-bedroom condo in Mission District sold for $1.14M (interquartile range $881K–$1.34M, 66 sales) in the 12 months through October 2026, per public sale records tracked by SF Homes Report.

How much does a 3-bedroom house cost in Mission District?

The median 3-bedroom house in Mission District sold for $1.75M (33 sales) in the 12 months through October 2026, per public sale records tracked by SF Homes Report.

How walkable is Mission District?

Mission District scores 73/100 on SF Homes Report's walkability index, ranking #8 of 46 San Francisco neighborhoods. Scores are built from public datasets (DataSF, EPA, Census).

Is Mission District safe?

Mission District ranks #40 of 46 San Francisco neighborhoods for safety on SF Homes Report's index (#1 = best). Its crime density score is 76/100, where lower is better. Scores are built from public datasets (DataSF, EPA, Census).

Are home prices going up in Mission District?

Median price per square foot in Mission District in the 12 months through October 2026, compared with the 12 months before: houses up 11% ($1,053 vs $946, 85 and 80 sales); condos up 9% ($997 vs $914, 159 and 169 sales), per public sale records tracked by SF Homes Report.

How does Mission District rank among San Francisco neighborhoods?

Mission District ranks #29 of 46 in SF Homes Report's overall neighborhood ranking, which blends walkability, safety, transit, schools, amenities and appreciation from public data.

2 Bedroom Homes

Based on SF Assessor data from the past 5 years

$1,220,940
Median Price
$1,073
Avg Price/SqFt
188
Total Sales
+4.6%/yr
Avg. Annual Appreciation

3 Bedroom Homes

Based on SF Assessor data from the past 5 years

$1,680,490
Median Price
$1,064
Avg Price/SqFt
139
Total Sales
+6.1%/yr
Avg. Annual Appreciation

Neighborhood Map

Data Layers
Master composite score (0-100) combining all neighborhood data: safety, walkability, commute access, schools, kid-friendliness, appreciation, dining, terrain, transit, parking, bikeshare, cleanliness, sunshine, and more.
Neighborhood quality per dollar: Best Locations composite score divided by median price per square foot. Higher scores indicate areas where you get the most livability for your money.
Composite neighborhood accessibility combining walkability, commute ease (BART/Muni/freeway), bikeshare density, terrain flatness, and street parking availability.
EPA National Walkability Index (1-20 scale) interpolated to 2020 Census block groups. Based on intersection density, proximity to transit, and employment mix.
Bay Wheels (Lyft) bikeshare station density by dock capacity per block group. Higher values indicate more bikeshare infrastructure.
Street parking availability derived from SFMTA meter density. Fewer meters indicates more free/unrestricted parking. Residential neighborhoods score highest.
Terrain flatness score derived from USGS 1m DEM elevation sampling (~200m grid). Local slopes computed from nearest-neighbor elevation differences. Flatter areas score higher.
Severity-weighted crime density from SFPD incident reports (last 12 months). Violent crimes weighted higher. Based on initial reports geocoded to block groups.
Pedestrian safety score based on inverse density of pedestrian-involved traffic crashes (last 3 years). Severity-weighted: fatal and severe injuries count more. Fewer crashes = safer.
Night safety score based on inverse density of 311 streetlight complaints (last 12 months). Fewer complaints suggest better-maintained lighting infrastructure.
Sidewalk condition score based on inverse density of 311 sidewalk and curb complaints (last 12 months). Fewer complaints indicate better-maintained walkways.
Food service business density from DataSF registered business locations. Includes restaurants, cafes, bars, and food trucks.
Road condition score based on inverse density of 311 street defect complaints (last 12 months). Fewer complaints indicate better-maintained roads.
School access score weighted by grade level (elementary highest) and type (private bonus). Measures density and quality of nearby schools per block group.
Composite family-friendliness: playgrounds/rec facilities, library proximity, school density, crime safety (inverse), walkability, and pedestrian traffic safety.
Median annualized home appreciation from actual repeat sales (same property sold 2+ times) in the SF Assessor roll (2007-2024). Based on assessed value changes at sale events under Prop 13 reassessment.
Recent residential sales activity (2019-2024) per block group from SF Assessor roll. Log-normalized count of detected ownership transfers. Higher = more active market.
Median assessed price per square foot from recently sold residential properties (2020-2024) in the SF Assessor roll. Assessed values reflect Prop 13 reassessment at sale.
Compound annual growth rate (CAGR) of home values over the last 5 years, derived from Zillow Home Value Index at neighborhood level. Mapped to block groups via neighborhood boundaries.
Compound annual growth rate (CAGR) of home values over the last 10 years, derived from Zillow Home Value Index at neighborhood level.
Compound annual growth rate (CAGR) of home values over ~22 years (2000-2022), derived from Census 2000 and ACS 5-Year median home values at tract level (~200 tracts).
Compound annual growth rate (CAGR) of home values over the last 50 years (since ~1975), derived from FHFA House Price Index at Census tract level.
Composite score of Muni rail/streetcar proximity, freeway access distance, BART station proximity, and Muni bus stop density. Higher scores indicate easier commute options.
Street tree density per block group from DataSF EveryTreeSF census. Log-normalized so residential neighborhoods with moderate tree cover score well relative to parks.
Street cleanliness score based on inverse density of 311 cleaning/dumping/graffiti complaints (last 12 months). Fewer complaints = cleaner neighborhood.
Neighborhood quietness based on inverse density of 311 noise complaints (last 12 months). Fewer noise complaints = quieter area.
Cafe and coffee shop density from DataSF registered businesses (NAICS 7225). Log-normalized to better represent neighborhood cafe culture.
San Francisco microclimate sunshine score based on DPW fog/sun zone classification. Eastern neighborhoods sheltered by Twin Peaks get significantly more sun than western fog belt areas.
Median household income per Census block group from ACS 5-Year Estimates. Higher values indicate wealthier neighborhoods.
Owner-occupied housing rate per Census block group from ACS 5-Year Estimates. Higher homeownership indicates community stability and investment.
Percentage of pre-1930 buildings (Victorian & Edwardian era) per block group, from SF Assessor Secured Roll property records. Higher scores indicate more historic character.
Pet friendliness score combining pet business density (stores, vets, groomers) and proximity to dog parks/play areas. Higher scores indicate more pet-friendly neighborhoods.

Available Listings in Mission District

Sort By: Newest First
89 listings found